
17May
How I Simplified Complex Data into Clear, Engaging PowerPoint Visuals
Struggling to turn raw data into clear PowerPoint slides? Here's how I tackled cluttered presentations and finally got visuals that actually made sense.
Read More

Presentation design, digital marketing & market research for businesses worldwide.
Loading blog…
Struggling to turn raw data into clear PowerPoint slides? Here's how I tackled cluttered presentations and finally got visuals that actually made sense.
Read More
Learn how I converted dense cloud SaaS reports into polished PowerPoint decks with clear data visualization and stakeholder-ready slide design.
Read More
Learn how complex data visualization challenges in PowerPoint were solved fast under tight deadlines with expert presentation design support from Helion360.
Read More
I had one week to build a dynamic KPI dashboard in PowerPoint. Here's how the project went, where I got stuck, and how it finally came together.
Read More
Learn how I built an engaging risk management training presentation in PowerPoint — with visuals, charts, and clear structure that helped new professionals understand the concepts.
Read More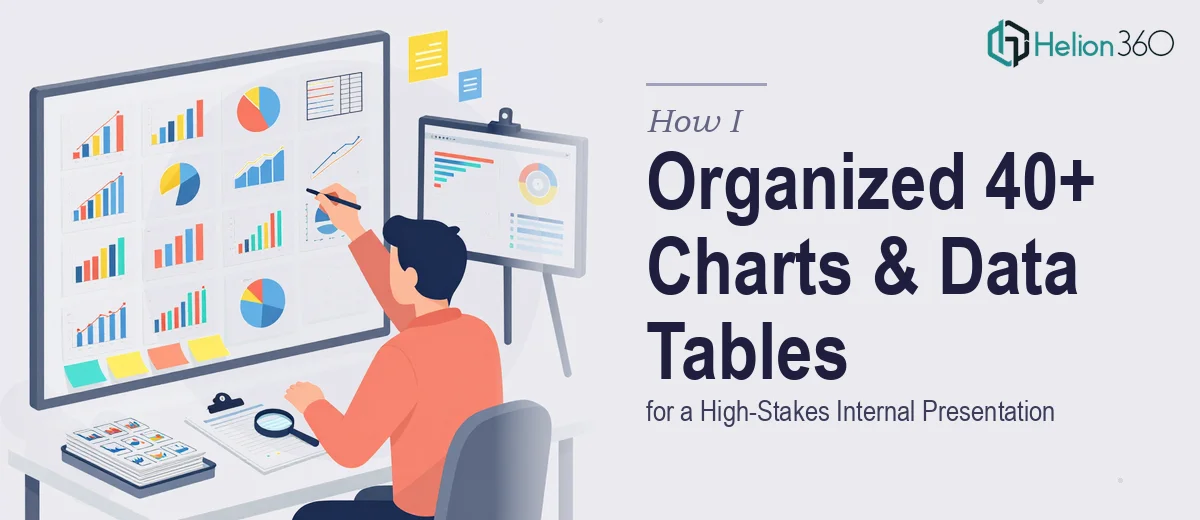
I had 40+ PowerPoint charts to highlight and 22 data tables to format under a tight deadline. Here's how I got it done with help from Helion360.
Read More
Struggling with dissertation graphics and charts in Word and PowerPoint? Here's how I got publication-ready visuals that accurately represented my research data.
Read More
Learn how I tackled complex PowerPoint graphic recreation, hit real design limits, and how Helion360 delivered polished, accurate data visuals that worked.
Read More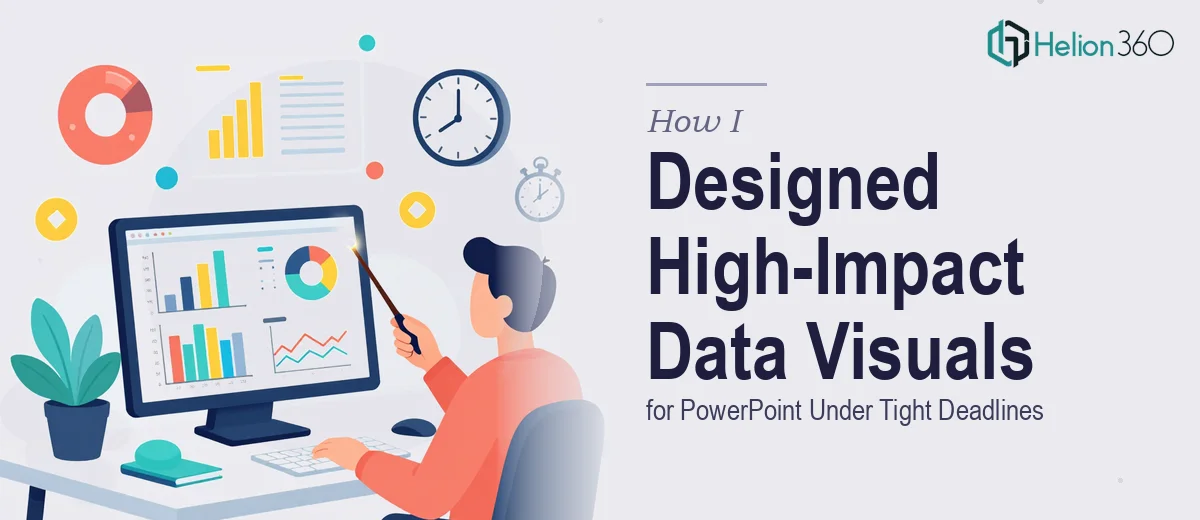
Needed compelling graphs and visuals for a PowerPoint fast? Here's how I handled a tight deadline and what I learned about getting high-quality slide graphics done right.
Read More
Learn how I built professional custom charts in PowerPoint using shapes, proper data visualization techniques, and got expert help when it got complex.
Read More